
Interactive Maps
Select the county you are interested in from the drop-down and hover over a ZIP code to view more information. To navigate the maps:
- Hold shift, click, and drag to pan the map.
- Hover over the map to view map controls in the top left.
- Use the Search Map button to zoom to a city or ZIP code of interest in the county.
- Use the Zoom In and Zoom Out buttons to zoom in and out of an area of interest.
- Use the Zoom Home button to pan out to view all ZIP codes selected in the county.
- Use the Zoom Area, Pan, Rectangle, Radial, and Lasso buttons to zoom and pan the map.
- Use the Undo button on the bottom right to undo a selection.
- Use the Reset button on the bottom right to clear ZIP code selections and pan out to view all ZIP codes in the county.
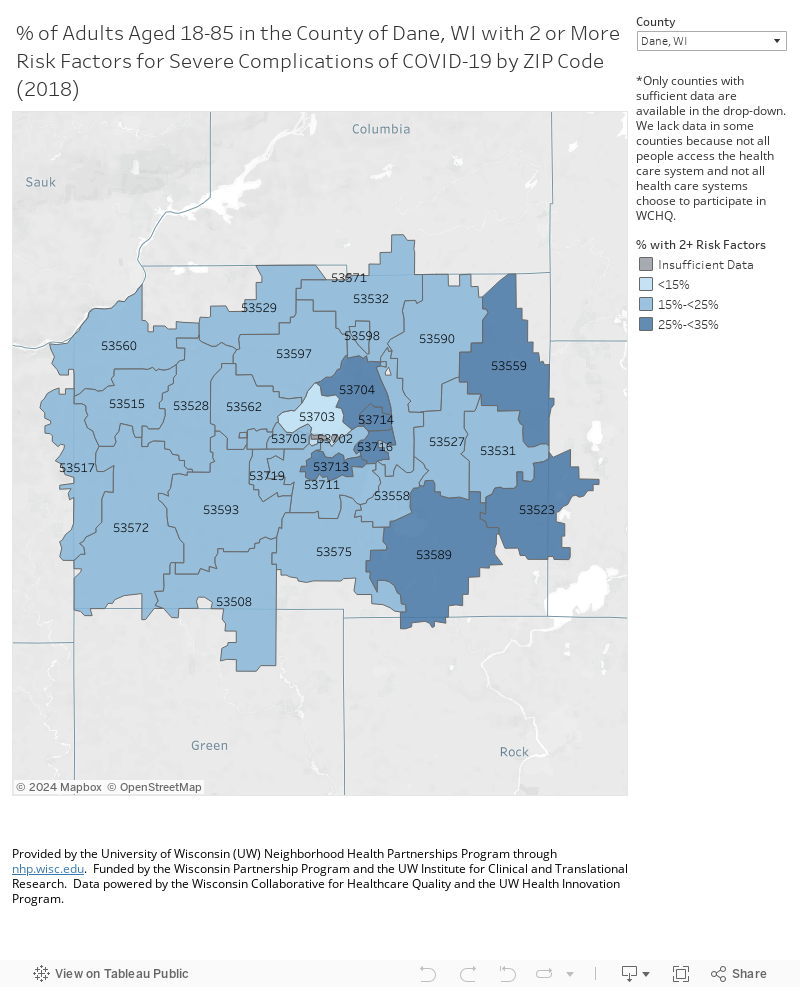
% or prevalence refers to the number of cases of a given condition or disease in a particular population at a given time. We have calculated estimated prevalence (%) by taking the number of individuals with two or more risk factors in the WCHQ data (numerator) divided by the total number of individuals in the WCHQ data (denominator: adults aged 18-85 years who are under regular care by a WCHQ member health system)
Coverage refers to the number of adults, ages 18-85, who are patients under regular care by a WCHQ member health system compared to the US Census 2014 – 2018 American Community Survey 5-Year Estimates. We have calculated estimated coverage in each ZIP by taking the total number of individuals in the WCHQ data (numerator: adults aged 18-85 years who are under regular care by a WCHQ member health system), divided by the Census estimated number of individuals in the same age range (denominator)
What are the risk factors for severe complications?
The COVID-19 risk factors for severe illness, as identified by the Centers for Disease Control (CDC)* and considered for these maps, include:
- Ages 65 and older
- Tobacco use
- Severe obesity (had a body mass index (BMI) greater than 40 during their most recent screening)
- Immunocompromised conditions including lupus, rheumatoid arthritis, HIV/AIDS, malignant neoplasm, or multiple sclerosis
- Diabetes
- Serious heart conditions
- Chronic kidney disease
- Lung diseases including asthma or chronic obstructive pulmonary disease (COPD)
- Liver disease
*On June 25th, 2020 the CDC made an update to their published risk factors for severe illness from COVID-19. Neighborhood Health Partnerships is currently evaluating these changes and, if appropriate, will release revised reports and maps in the coming weeks.
How do I make sense of the maps?
Making sense of these maps requires an understanding of the data in context, including the neighborhood conditions where people live and the opportunity they have to be healthy. It also means understanding the past and present policies and practices in the community.
Data indicating differences between communities, in particular, can only tell part of the story of how these differences came to be and continue to exist. This is because the root causes of health inequalities – preventable and unjust differences between who does and who does not have access to resources for living healthy and safely – are not reflected in the datasets of health outcomes. These root causes are often historically and structurally embedded and are less visible than health outcomes.
Data in a map may show a ZIP code has a higher percentage of residents with risk factors for developing severe complications from COVID-19. However, these maps do not provide additional contextual information about the conditions and resources that people need to be healthy. Health inequities by place of residence are visible in the data, while the root causes are not. These root causes are important to consider and have a significant impact on the people represented in these data.
Without recognizing the role of the root causes of health inequities, we run the risk of drawing conclusions about communities that are untrue and harmful. Responsible data-users will be careful to not draw conclusions from incomplete datasets that might reinforce harmful and limiting stereotypes about communities, and appreciate that a dataset can only ever tell us part of the story. They will connect these datasets with local knowledge about factors at the individual, neighborhood, organizational, community, and policy levels that impact health outcomes.
In addition to recognizing what is not represented in the maps, you should also understand that there are limitations to this data itself as not all people access the health care system and not all health care systems are able to share their data. Due to these factors, and others, the data in these maps may not accurately reflect the entire population of a ZIP code or County.
Our partners at the Population Health Institute have created and curated some must-read COVID-19 resources that focus on the social determinants of health and equity.
What can I do with the maps?
We strongly encourage you to use these maps, along with other available data, information and resources when planning COVID-19 responses or any other efforts to improve the overall health of your community.
County Health Rankings and Roadmaps and What Works for Health have a wealth of information that can help you form a more complete view of your community’s needs and all the factors that may influence health. They will also help you to assess your needs and available resources, focus on what is most important in your community, choose effective policies and programs and take ultimately action.
Where is the data coming from?
Through a partnership with the Wisconsin Collaborative for Healthcare Quality (WCHQ), the data used includes 2018 electronic health record data over 20 health system members of WCHQ, representing approximately 65% of Wisconsin’s primary care providers. To learn more about WCHQ, click here.
We included any individual, aged 18-85, that was under regular care by a WCHQ member health system that has chosen to report their data. WCHQ Members who contributed data included in these reports include:
Agnesian Healthcare, Ascension North Region and Fox Valley, Ascension | Columbia St. Mary’s, Ascension | Wheaton Franciscan Healthcare, Aspirus Clinics, Inc., Associated Physicians, Divine Savior, Froedtert & The Medical College of Wisconsin, Gundersen Health System, Mayo Clinic Health System – Franciscan Healthcare, Mayo Clinic Health System in Eau Claire, Mercyhealth, Meriter Medical Group, Monroe Clinic, Prairie Clinic, Prevea Health, ProHealth Medical Group, Reedsburg Area Medical Center, SSM Health, Dean Medical Group, UW Health Physicians and Wildwood Family Clinic
Learn More
If you have questions or would like to learn more about the Neighborhood Health Partnerships Program, please contact us at nhp@hip.wisc.edu.